Coming soon? Google bike mapping in Amsterdam

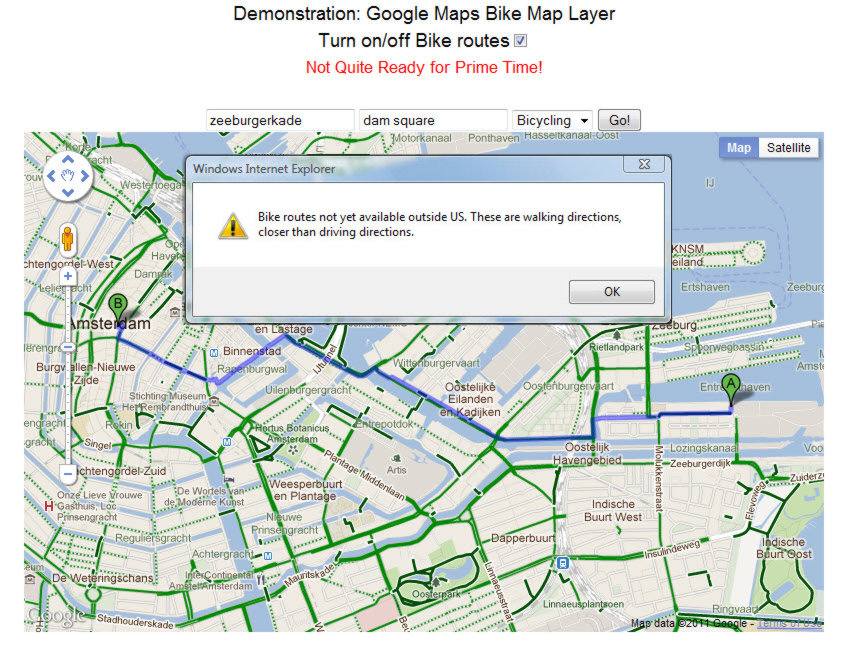
Over a year ago, Google announced a bike path layer and biking routes in the U.S. It seems this is easier said than done in Europe. But they must be close! Playing with Google api V3 we discovered the Bicyclinglayer, and discovered it exists here too! Here is my sample map (8/1/2019 – doesn’t work any more). The bike layer can be turned on or of, but attempt to route for Biking and it does not work. (It would work in the US, except that I have switched to “walking” for this demo.)

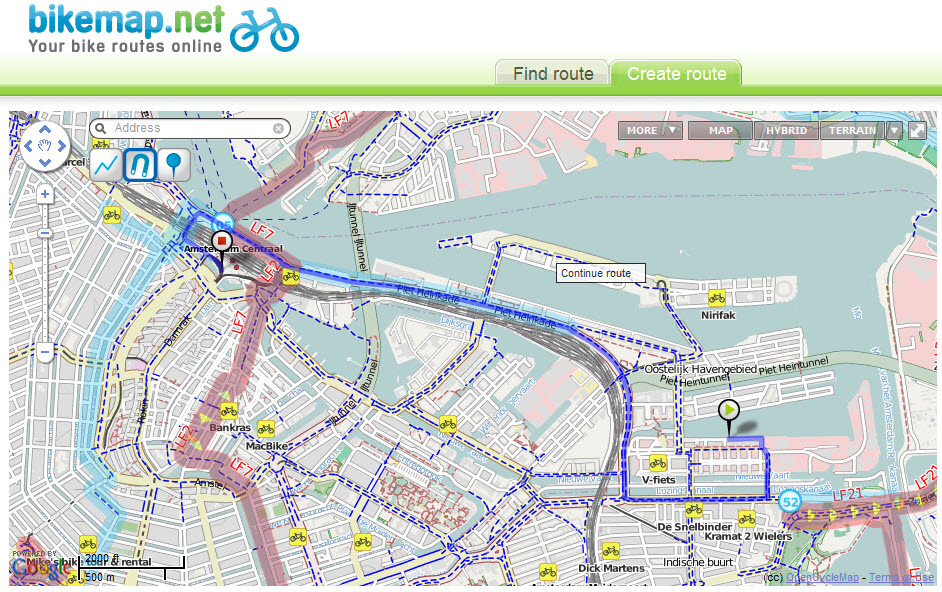
There is already the international open cycle map layer… so can’t they get together on this? Open cycle map is one of the backgrounds on the excellent free website, Bikemap.net. However this is a point and click route planner, and does not use the underlying bike map layer for routing.

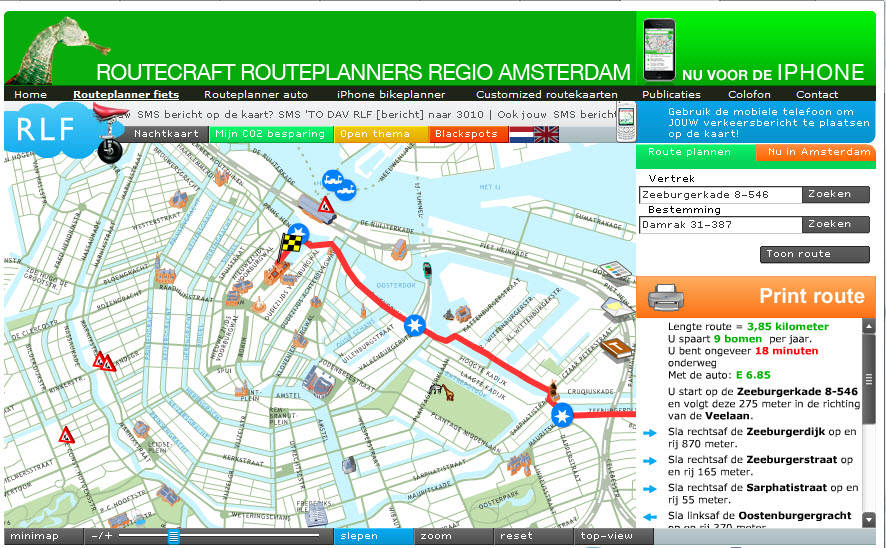
Another approach, specially designed for use in Amsterdam is Routecraft Routeplanner, was developed by DAVdigital which also makes customized maps, interactive and static, for organizations in and around Amsterdam. This one really works (within greater Amsterdam), so it wins the prize for up-and-running.

The Middle East Puzzle

This is a nice and useful little Flash puzzle from Rethinking Schools.org. (I was going to look up these things anyway, and this is a nice mnemonic tool.) Checked myself on the second try and I performed significantly better… maybe I should have another go for perfection. I wonder how this was made and by whom… trying to find the source. It would be nice to also identify cities, rivers etc. this way. I guess American kids are trying to catch up and overcome the image crated by Miss South Carolina a couple of years ago!
I have a feeling that all of these names will become much more familiar in the decade ahead.

Mapmakers Extraordinaire!

The jig is up. These are the pros: Axis Maps. Based in (I think) Madison Wisconsin, these guys combine all the technical skills with fantastic design. Much to be learned on their website, including many useful GIS resources, and links to their Indiemapper online map-making site. It appears they also worked with Fortiusone to develop the online map interface for Geocommons.

Update 3/9/2018:  Geocommons appears to be broken, but a description of the map service is here, at Duke.

Mannahatta

Planning a trip to New York?  The Museum of the City of New York has three exhibitions of special interest to Nederlanders.  This one is for map-people, too.  Written-about in an Arts section review in the New York Times, the exhibition sounds a delight, and there is a book by the exhibition designer, Eric W. Sanderson and a clever Google maps mashup website about the Mannahatta Project sponsored by the Wildlife Conservation Fund.   Time to travel.

Update 5/7/2018: In 2010, and until 2013, the Mannahatta Project became the Welikia Project. In 2017 an entry in Jason King’s blog Hidden Hydrology explains recent project developments. 

Red Lines in Queens

The exhibition, Red Lines Housing Crisis Learning Center  at the Queens Museum of Art (through Sept 23) is a large scale installation by Damon Rich, founder of the Center for Urban Pedagogy.  The New York times reported  on the exhibition’s extraordinary centerpiece, an intricate conversion of the museum’s most famous work, the Panorama of the City of New York , to depict the location of foreclosures in the five-borough area.  The Panorama is a 9335 sq. foot scale model (1 inch = 100 ft) of Manhattan and all five boroughs made in 1964 for the World’s Fair, and updated in 1992.  On top of this 3-D “map”, Damon and his young helpers placed bright pink plastic triangles representing blocks where 3 or more foreclosures have taken place.  The result shows the concentration of foreclosures in areas where the non-white population is highest.

According to the Times:  ”Hundreds of these pink stigmata cover Bedford-Stuyvesant, Crown Heights, East New York and Canarsie in Brooklyn like an invading army. In Queens most markers are camped out in Ozone Park and Cambria Heights, as well as in parts of Jamaica and Corona. As for Manhattan, there are precisely two.”

The neighborhoods with high foreclosures, according to the Times, are the same areas where the disastrous practice of “redlining” denied credit to African-American and Latino families until it was made illegal in the 1970′s.  The data used in creating the exhibition was also used by NY Times staff to create a great interactive map which allows you to see the growth of foreclosures across the area, and at the block level, since 2005.  Frightening!

Update 5/7/2018:   New Forclosure Maps from PropertyShark