EPA Chooses Microsoft Virtual Earth

James_Fee_Illustration
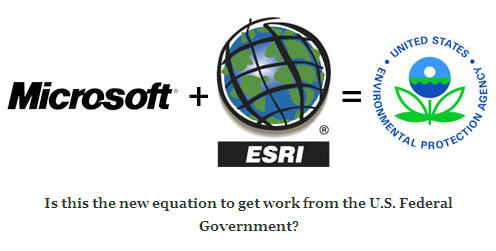
James Fee wrote about the Sept 13 Microsoft announcement that the US Environmental Protection Agency (EPA) has licensed Microsoft Virtual Earth (for one year, with possible extension to two) for “mission critical” applications.  According to an article in Federal Computer Week (FCW), the partnership between Microsoft and ESRI contributed to the selection, as the EPA can leverage its existing ESRI GIS resources.

Why not Google Earth?  According to a Bloomberg interview with EPA’s Pat Garvey, the fact that GE requires that the user download an application, whereas VE is all browser based was a key factor.

mapdotnet_miamiAn alternative path to putting “real GIS” on the web with MS Virtual Earth (and ESRI’s geodatabase ArcSDE) is using ISC’s MapDotNet Server.  This product competes with ArcGIS Server, and according to the ISC blog  they were “kicked out” of the ESRI partner program last spring.

Microsoft VE vs. Google Maps

jonasson_side_by_sideTo compare the coverage offered by these two Web online mapping tools, a programmer, Ryan Jonasson, in South Dakota has come up with a “side-by-side” viewer. While Microsoft’s VE is really a cross between Google Maps and Google Earth (right now), it lacks detailed “aerial” views outside of the US, UK and France.  (The default on this viewer is “aerial”, so be sure to change to “road” if you zoom in to a European city.)

Coverage is changing every time the earth turns.  Google Lat Long announced (Sept 15) detailed maps of 54 more countries, from Aruba, to Iran and Iraq, to Yemen.  Here’s a list of the new Google countries: Continue reading ‘Microsoft VE vs. Google Maps’

Update 30/5/2018:  None of the links above work any more. Both Bing and Google maps have greatly evolved.  Back then, it was early days. Here’s a more recent comparison of features Bing maps vs. google
In June 2017, MakeUseOF published this comparison of alternatives to Google Maps: Six Google Maps Alternatives. These include Bing, Waze, OpenStreetMap, Mapquest, Rand McNally, and Here. Pros and cons for all. More about this later.
And then there is maps.me

Public Health in the Netherlands

smokers_2001_2004_NL_RIVMThis RIVM (Rijksinstituut voor Volksgezondheit en Milieu)website includes a comprehensive Atlas of public health in the Netherlands.  For example, this map of smokers in the Netherlands, by region. While the average has dropped since 2001 from about 33% to 30%, there has been little change despite bans on smoking in many public places in 2004.  The 30% rate, according to the BBC in a November 2004 article, was higher than all other European countries except Spain, Greece, and Germany.  Also to be noted, in September 2007, RIVM launched a new “Milieuportal“, targeting environmental professionals (and consumers), tracking air and water quality.

smokers_2016_NL_RIVMUpdate 28/5/2018:  The Atlas website has a new link.  The latest smokers (rokers) map does show a large drop.  It would be interesting to look at the data sources, but the maps give the picture.  Highest rates in 2016 are 10 points lower than 2004 values.  The Milieuportaal seems to have disappeared, but the RIVM site has a wealth of information.

EUC2007: Cellular Expert

cellularexpert_visibility_screenshotAn exhibitor at EUC 2007 in Stockholm was HNIT Baltic from Lithuania, makers of Cellular Expert, an ArcGIS extension for wireless telecommunications networks planning, optimisation and data management. A technical article in an ESRI’s Telecom Connections Winter ’07 (see page 4) publication describes research done by Ball State University, using Cellular Expert together with ArcGIS and various extensions.

EUC2007: SpaceNavigator

3d_connectorAt ESRI EU conference in Stockholm,  3DConnection, a division of Logitech, demo-ed SpaceNavigator for use with ESRI’s ArcGlobe (but of course, it works with Google Earth, too).  Its a 3D mouse priced for consumers (59€ or $59, so guess where I’ll buy it.)  This has been available for a year, launched in Australia, so maybe I’m the last to know about it.  Beautifully constructed and intuitive, there are various more expensive models with more features .  This works with SketchUp and other 3D design applications.

EUC2007: Diamond Touch

MERL_DiamondTouchNow this is really, really cool. MERL (Mitsubshi Electric Research Labs) showed a tabletop ”touch-and-gesture-activated” screen, hooked up to an ordinary laptop and ordinary projector (suspended above). It is billed (in the online fact sheet) as “the world’s first multi-user touch technology”. Maybe gaming will be the killer app for this product, but disaster response is the GIS-related application which brought MERL to EUC2007. Continue reading ‘EUC2007: Diamond Touch’. (No longer available.)

Heatloss Map

haringey_heatloss_mapAll Points Blog recently commented on an interactive map of Harringay (a London borough) showing on a house-by-house basis the amount of heat at the time of a “flyover” in the year 2000.  This public website has been somewhat controversial, but may point the way to a future application which could help identify soruces of heatloss.  A new flyover took place last March so the map will be updated.  An article in the Times (May 4, 2007).  A company called  Hotmapping carried out the survey and is offering their services to other boroughs.

According to a Times article:  “Almost 60 per cent of a household’s heat is lost through uninsulated walls and lofts, according to the Energy Saving Trust (EST), costing the average home up to £380 each year.  Insulation is estimated to reduce each home’s carbon emissions by about two tonnes annually. More than half of the UK’s carbon dioxide emissions come from the domestic sector, taking into account both homes and transport. “

Adaptation

elevateThe CCsP conference September 12 and 13 in Den Haag included many fascinating presentations by climate experts from the Netherlands, other European countries, Brazil and the US.    Many ongoing projects are looking at risks, costs, and even opportunities, focusing on two concurrent approaches:  mitigation and adaptation.  Dr. Jeroen Aerts from the Vrij Universeiteit discussed Climate adaptation: cross-sectoral approaches in relation to land use and spatial planning (ppt, 17.8Mb – link no longer available, 2018) .

Update June 2018 – Article co-authored by Aerts titled Integrating Human Behavior Dynamics into Flood Disaster Risk Asessment (available for a price!)
This news article describes the contents. https://www.cmcc.it/article/human-behavior-is-the-key-to-reducing-flood-risk

Map of Maps

british_library_mapsA post today on the interesting Free Geography Tools blog provides a summary of some of the great digitized historical map collections.  For example, the British Library has a large scanned maps collection, and an oddly anachronistic feature:  London: A Life in Maps featuring red google pushpins identifying the point of focus of various antique maps and prints  of London.

leo_belgicusAnother interesting British Library holding is the Christofel Beudecker collection of Dutch maps, purchased by the ritish Museum in 1861.

An example is this charming Leo Belgicus which reminds us that maps were fun even back then.

Sniggering with Maps For US

Cartography met pop culture a week ago when a candidate for Miss South Carolina answered a tough question about American school children’s geographic myopia.  She was asked what the reason could be for the fact that 1/5th of Americans cannot locate the US on a world map. (That was the NOTfunny part of the story.)   Her bizarre answer included the assertion that “Some… people out there in our nation don’t have maps.”   Since then, more than 11 million people have viewed the YouTube video, making it the most viewed video for the past month, and in the top 50 for all time, even after just a week!   Embarrassing as it was and is for us “U.S.-Americans”, it is also hilarious and provoked many delightful responses, especially the website MapsForUs.org, which continues the exploit the merriment (and has a link to the video). Did she win? Came in fourth.

Update: 27/6/2018:  67 million people have viewed the video.  Miss South Carolina, Caitlin, had a rough time after the video went viral, but seems ok for now. The website MapsForUs.org, meanwhile, has not fared so well.  Doesn’t exist.