World Food Program


World Food Program won the Nobel Peace Prize 2020.  The agency was given the prize for its efforts to combat hunger and improve conditions for peace.

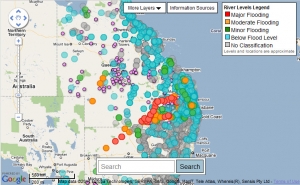
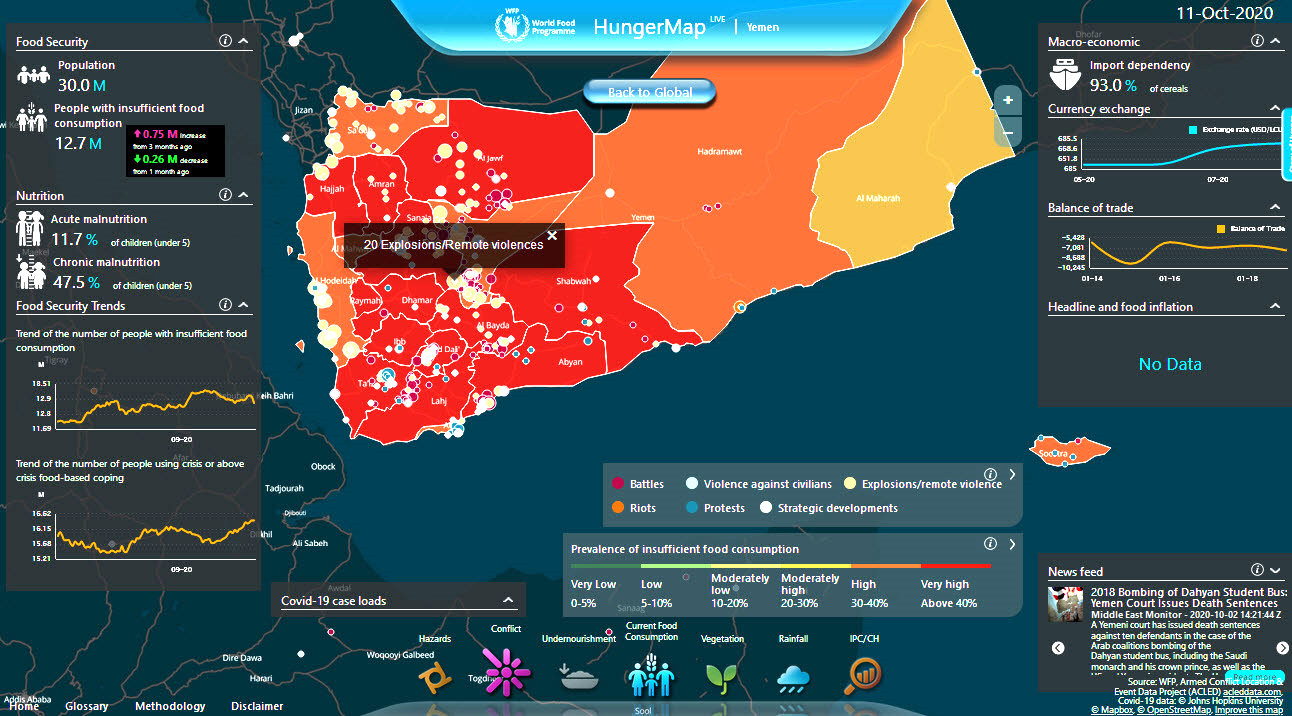
This interactive “Hunger Map” contains an amazing amount of detail and links to numerous databases tracking the world situation on a daily basis.

Some of the indices and trends are not as clear as others, but this appears to be an amazing data resource. Overlays include vegetation, rainfall, crises of all sorts, conflicts, and COVID-19 cases and deaths.

Take Yemen…

Sandy Missed My House

It was amazing to sit on the sofa on October 30th, watching the weather reports on TV and following the storm on the internet with Wundermaps, as it astonishingly went right around my house in Beacon NY. Tragic consequences in the New York boroughs, and especially New Jersey. An article in the Architectural Record interviews participants in the precient MOMA exhibition two years ago, Rising Currents, about ideas which might be revisited in the wake of the storm. The weight of the evidence, however, seems to be in favor of barriers. Expect to see some experienced Dutch engineers migrating to NYC.

Crowdsourcing Irene

New York City’s Severe Weather site allows victims or observers to document their damage through a reporting feature. This comes with the caveat “Insofar as any posts made concern weather conditions and weather-related service disruptions, the City will not take action.” I’m not sure why people would use this tool, but perhaps in the future it will be a real communications tool. The same site was used for reporting neighborhood situations during the big blizzard last year, according to Mashable.

Queensland Down Under

We watch helplessly as Queensland went down under this week, and then gradually resurfaced wallowing in mud with at least 18 lost lives and billions in damages.  Examples of disaster maps produced in response to the crisis include:  1) Before and after photos by Nearmap.com, an Australian company offering areal photography services showing change over time in an Open Street Map environment.  2) Google’s crisis response map. 3) The Brisbane City Council situational awareness map created by  ESRI Australia using ArcGIS and Bing Maps.


Snow (almost) everywhere in the States

Via GISUser blog:  “There’s snow in all the contiguous States except Florida – and in a good portion of Canada too! Via NOAA, Every state, with the exception of Florida, currently has snow on the ground. This includes Hawaii where about seven inches of snow is atop Mauna Kea. As of Jan. 11, 69.4 percent of the contiguous United States is covered by snow – this is more than double the snow cover from last month. This week’s snow storm in Southern states has allowed for this unusual occurrence.(Image credit: NOAA)”