Wolf Tracking

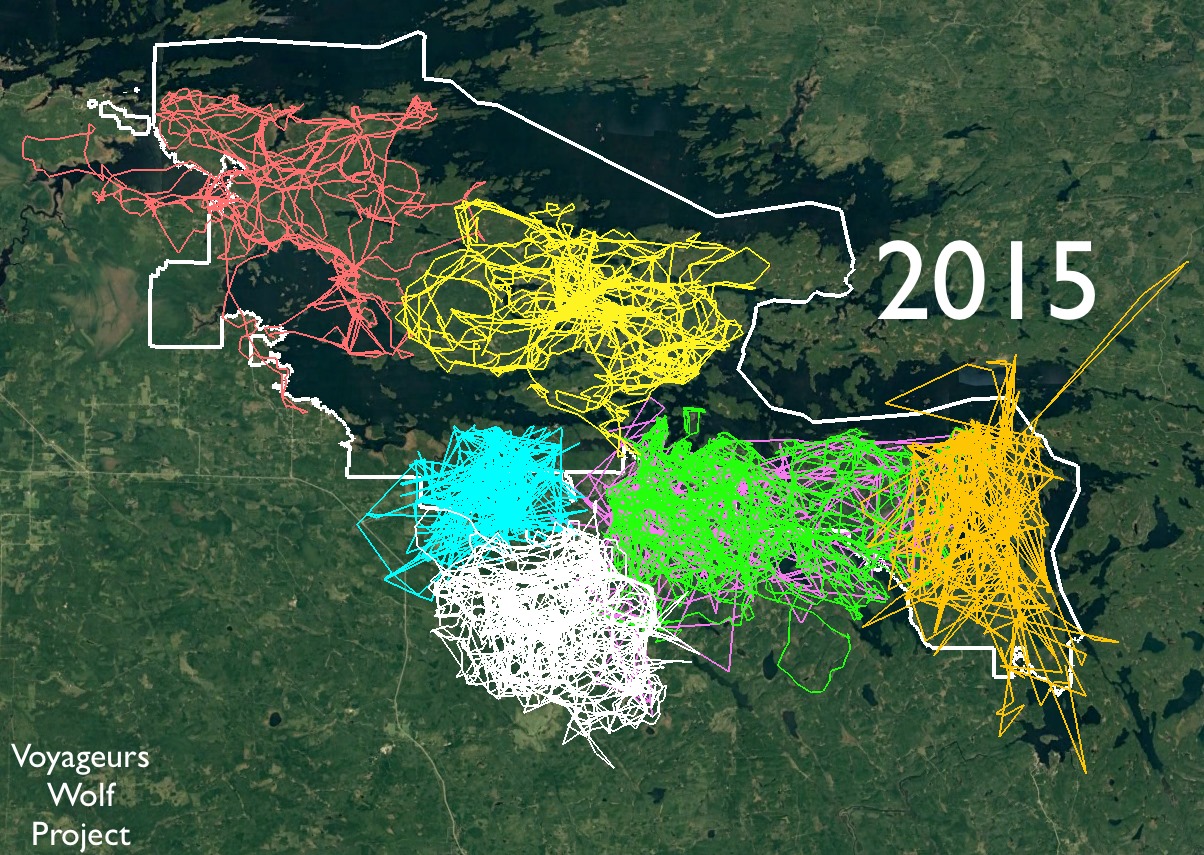
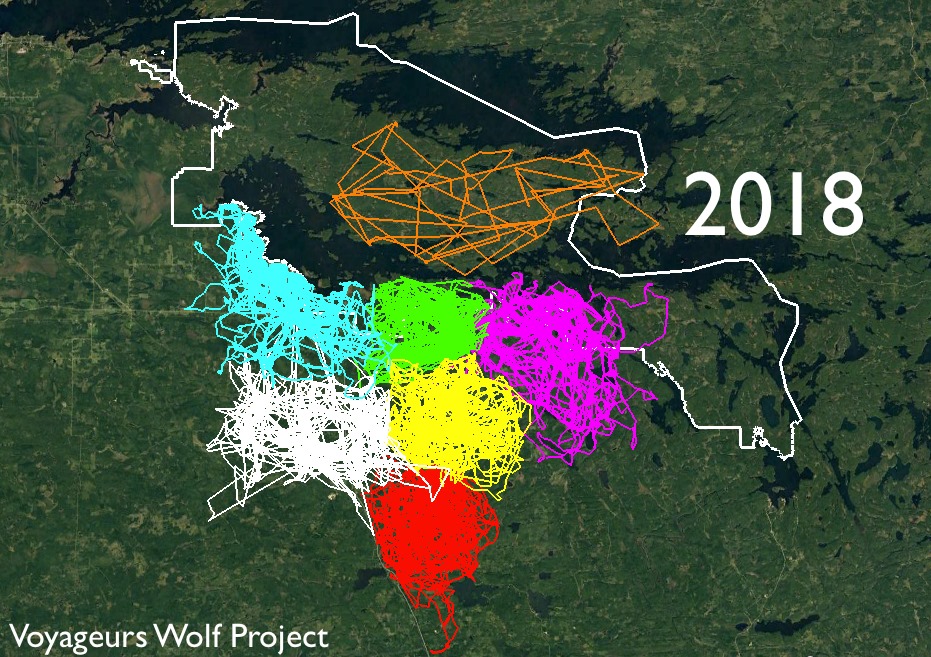
Wolves are awesome and endlessly fascinating, maybe because of their similarity to our favorite pets. One organization provides all the data, videos and some amazing maps, to satisfy the most die-hard wolf-lovers. As their Facebook says,  Voyageurs Wolf Project studies wolves and their prey (moose, deer, and beavers) during the summer in the Greater Voyageurs Ecosystem, which includes the area in and around Voyageurs National Park, in northern Minnesota. These images, posted in Jan 2020, show the movements of various packs within the Voyager park area, generated by putting gps collars on pack members. There are unanswered questions as to whether some packs disappeared, new ones formed, etc.

For a day (or days) in the life of wolfie, check out Voyager’s website, and this page of animations.

North American Environment on the Map

A nice site for easily and intuitively viewing environmental data, perhaps aimed mostly at children, but with a nice feature for integrating with Google Earth, and for downloading the data. (The US and Canada are still far ahead in making it all free!) The site was created by another interesting organization, Greeninfo Network.  Among other US and California-oriented projects, they have a nicely-designed online  crowdsourcing tool, MapCollaborator.

Tree Maps now Open

This open source software is designed to help cities catalog their trees through crowdsourcing. The San Diego version has more than 331,000 trees shown on the map with details about their species, size, and economic impact. The Grand Rapids treemap has over 17,000 trees pinpointed. Clearly these were cities with extensive tree databases in the first place who have brought this data into the opentreemap system so that it can be updated and maintained, and most importantly shared with the citizens. Very interesting concept! The Opentreemap software is available from an innovative GIS application and software design company Azavea.

The Ring of Fire

The website Our Amazing Planet, pointed out a beautiful map depicting earthquakes since 1989 around the world, using intensities of color to indicated the frequency. The map’s creator is John Nelson of Michigan-based IDV Solutions, a data visualization company which provides products and solutions including Visual Fusion.

Ends of the Earth at MOCA

The current exhibition at MOCA (the Museum of Contemporary Art in Los Angeles, Ends of the Earth, Land Art to 1974, includes an interactive Google map which geo-locates the various works of some of the artists represented and documented at the exhibition. Over eighty artists and projects from United Kingdom, Japan, Israel, Iceland, Eastern and Northern Europe, as well as North and South Americas are included in the show. Clicking on an artist’s name zooms to the location and a pop-up window describes the work of art… like this one by Joseph Bueys in a Scottish moor in 1970.

Update 8/1/2019: The MOCA site no longer has the map, but here it is on Google Earth – however it appears you must view this with Chrome. Link to Landart in Google Maps.

THERE’s where I’ve gotta be

Oh such a nice application (not new, but just discovered) from Dutch GIS organization, Alterra.  “Daar Moet Ik Zijn” allows you to pick the type(s) of landscape you like, weight them by how pervasive they should be, and how important they are… and then voom!  … nice map showing you which places fit your preferences.  This should be useful for … well, vacation planning, or in case I want to move somewhere, and by the way they are collecting statistics probably to understand what is important to Dutch people (at least geeks).  My map (shown) heavily weights woods.  I love my environment here in Amsterdam, but do miss the trees.

Queensland Down Under

We watch helplessly as Queensland went down under this week, and then gradually resurfaced wallowing in mud with at least 18 lost lives and billions in damages.  Examples of disaster maps produced in response to the crisis include:  1) Before and after photos by Nearmap.com, an Australian company offering areal photography services showing change over time in an Open Street Map environment.  2) Google’s crisis response map. 3) The Brisbane City Council situational awareness map created by  ESRI Australia using ArcGIS and Bing Maps.


Oil spill maps

Three ways to view the spill’s progress:   1)  Google Crisis center, with map data from NOAA  and PBS live news feed showing the gushing oil, and 2) Paul Rademakers Google Earth representation of the (no longer works), showing how it compares in size to Manhattan, London, Paris, etc, 3) New York Times”Tracking the Oil Spill in the Gulf“,map updated daily.

Update 3/9/2018: The Times site is still available. Wikipedia’s report is a good way to look back at the crisis and aftermath.

Mannahatta

Planning a trip to New York?  The Museum of the City of New York has three exhibitions of special interest to Nederlanders.  This one is for map-people, too.  Written-about in an Arts section review in the New York Times, the exhibition sounds a delight, and there is a book by the exhibition designer, Eric W. Sanderson and a clever Google maps mashup website about the Mannahatta Project sponsored by the Wildlife Conservation Fund.   Time to travel.

Update 5/7/2018: In 2010, and until 2013, the Mannahatta Project became the Welikia Project. In 2017 an entry in Jason King’s blog Hidden Hydrology explains recent project developments. 

Don’t forget

Earth Hour 2009, Saturday, March 28, 8:30 PM.  This global demonstration is a World Wildlife Fund initiative, and is being framed as a the world’s first global election.  The UN Sec General, Ban Ki-Moon, announced UN participation in a new video.   I’m spreading the word on the Zeeburgerkade!

Update 30/6/2018: Earthhour 2018 video.