Here’s where we’re headed

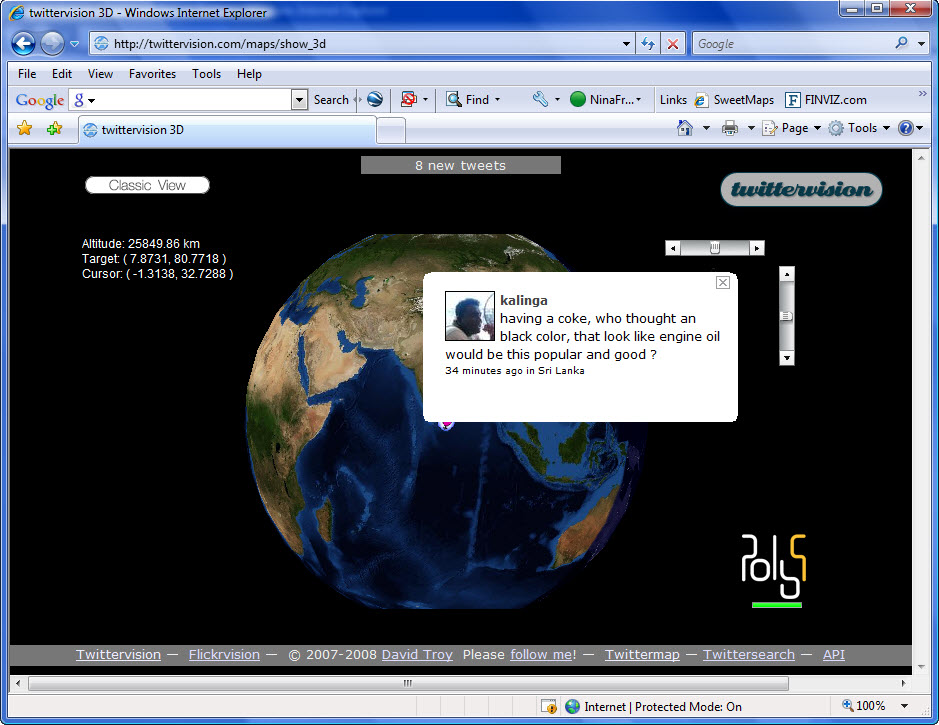
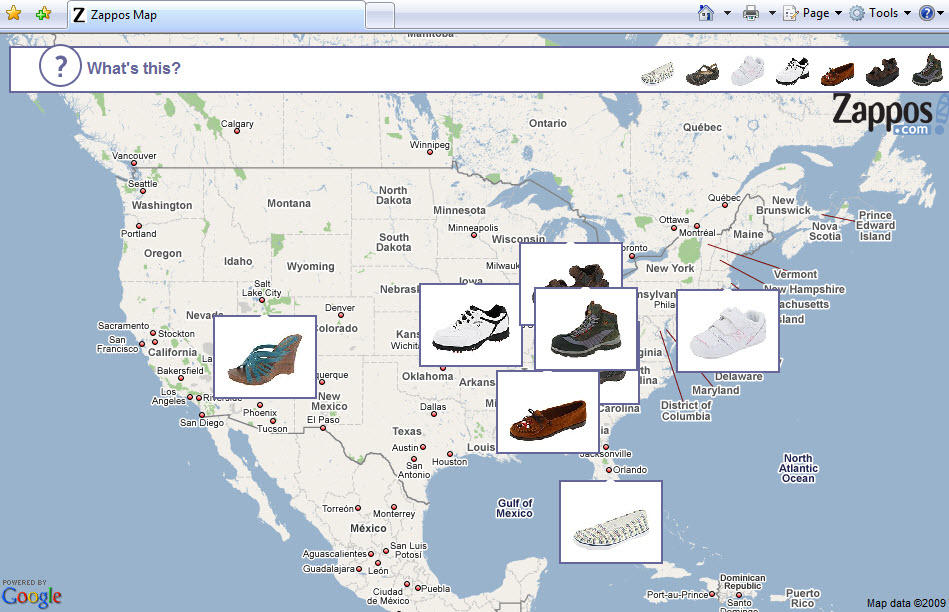
…to Zappo’s to buy shoes!  Twittervision (see last post) looks like the first in what will probably be a mesmerizing flock of new real-time map mashups.  In this Zap-map (No longer available) application, if you tire of the shoe-parade, click on a shoe and you get the details and an order form.  The map is actually not very useful, except for the compelling representation of a retail businesses volume and customer base.  Can’t help wondering if the speed will noticeably change as the economy recovers.  As a sales gimmick, this worked on me.  I hadn’t heard of Zappos before (not buying shoes online, obviously), and I just ordered my first pair (just to see if the map would fly to Amsterdam.)

Update 30/6/2018: Zappos bought by Amazon in July 2009, and this sweet app quickly disappeared.

Twittervision

Caution.  Twittervision (No longer available!) might make you dizzy.  Maybe it is also a cure for loneliness, if you can bear it.  It is certainly makes one ponder the meaning of it all.  These effervescent messages from real people around the globe, vanish as quickly as they appear, an alarming demonstration of time and space convergence.  Where are we headed? (Jan 8, 2011… this was fun but now seems broken).

Update 30/6/2018: New and awesome tweet map!!   Made by MapD.  Lets see how long this one lasts.

Birds Eye Streetview

They beat me to it!  Mapchannels created this very neat customizable mashup of Google Street View with Microsoft Bird’s Eye, with all the elements I was muttering about, to myself.  As a matter of fact, Mapchannels has several other nice tools which you can customize and put on your website.  So who are they?  Apparently, a very low profile organization, no name or location to be discovered, a mystery.   So in case you read this, Mapchannels, THANK YOU!

Update 30/6/2018: Amazingly, it still works!  New and Improved (Dam Square). Or try I Giardini in Venice! Explanation and Instructions from Mapchannels

Serious Business

A recent video, The Internet is Serious Business, created by New York’s Center for Urban Pedagogy (CUP), explores the Internet infrastructure in NYC, who owns it and why that matters.  This awareness-raising film targets schools and youth programs.  It was filmed by CUP staff and young people from the City-As-School  program and features a wacky alien (extraterrestrial, that is).

Update 30/6/2018: CUP continues with interesting projects.

Geography of Buzz

An  article in the New York Times  today discusses the use of a GIS spatial analysis technique referred to as ”cluster analysis” for an unusual application.  Researchers Elizabeth Currid of USC and Sarah Williams of Columbia University’s Spatial Information Design Lab  presented their conclusions at a meeting of the Association of American Geographers recently.  The researchers geocoded 300,000 photos and 6000 events from the Getty Imges  database.  With this data set, the Global Moran’s I statistic was used to find hotspots in New York and LA.  The conclusions may not be so very surprising, but the use of photo media is interesting.  This type of social research is likely to show up more often as people begin to mine data from geocoded images (e.g. Picasaweb and Flickr) or geotagged Tweets.

The study was partly inspired the work of  Richard Florida who developed the concept of the “creative class” and created a stir with Amsterdam planners at a 2003 conference titled “Creativity and the City”.

Update 30/6/2018: No doubt a lot more research in this area to be found. For example Trendsmap

Economic Crisis

This nicely constructed interactive flash map (no longer available) was published by the Dutch paper, the NRC, at the end of February, with data through 3Q 2008.  Not pretty, even in pink. Hopefully they will update it for 4Q, etc.  The data source is listed as Eurostat, which appears to be an excellent resource for general EU statistics.

For US economic statistics, a rich data source is the St. Louis Fed.  The NY Times published an interactive map based on Fed data, showing unemployment by county.  They updated the map from December to January (the image is December and the link is to January), but don’t yet have a map allowing monthly comparison.   In fact they use two different color classification schemes making comparison between the two maps visually impossible.   It would be nice if they made a comparative map like the NRC map.

Update 30/6/2018: These maps seem to be one-offs.  No current updates.

Dutch Street View

Google Street View arrived in the Netherlands last month, along with a creative application for Street View “sightings”, those funny and weird things caught by the Google car’s 360 camera.  If you don’t want to spend all your time coming the streets for something hilarious, you can take a look at what other people have found at “Streetview Nederland”.  So far just Amsterdam, Rotterdam and Groningen.  Note: anything too salacious or incriminating seems to be quickly removed, and if you want your house “blurred”, Google will do that.

Update 30/6/2018: Dutch version not available, but other sites developed… such as this – Streetview World . Better yet, google “Streetview sightings“.