World Food Program


World Food Program won the Nobel Peace Prize 2020.  The agency was given the prize for its efforts to combat hunger and improve conditions for peace.

This interactive “Hunger Map” contains an amazing amount of detail and links to numerous databases tracking the world situation on a daily basis.

Some of the indices and trends are not as clear as others, but this appears to be an amazing data resource. Overlays include vegetation, rainfall, crises of all sorts, conflicts, and COVID-19 cases and deaths.

Take Yemen…

North American Environment on the Map

A nice site for easily and intuitively viewing environmental data, perhaps aimed mostly at children, but with a nice feature for integrating with Google Earth, and for downloading the data. (The US and Canada are still far ahead in making it all free!) The site was created by another interesting organization, Greeninfo Network.  Among other US and California-oriented projects, they have a nicely-designed online  crowdsourcing tool, MapCollaborator.

Don’t forget

Earth Hour 2009, Saturday, March 28, 8:30 PM.  This global demonstration is a World Wildlife Fund initiative, and is being framed as a the world’s first global election.  The UN Sec General, Ban Ki-Moon, announced UN participation in a new video.   I’m spreading the word on the Zeeburgerkade!

Update 30/6/2018: Earthhour 2018 video.


Water Concerns


A visit to the Water: H2O=Life show at the Museum of Natural History was thought provoking and alarming. This could be the issue of the 21st century, drowning all others. (Sorry, no laughing matter.)

Water is not in short supply in the Netherlands, but management is and always has been a central concern. This Dutch website translated as “the Netherlands Lives With Water” (No longer available) 17/6/2018:  uses Google Maps to show water projects, events and attractions, a nice application created by GeoStart.  One event we will try to take in is a sculpture exhibition at the castle in Muiden, called “the power of water“.

Update 17/6/2018: GeoStart is now part of Leiden-based website developer SWIS

AMFORA

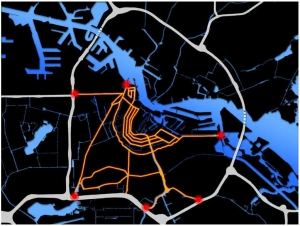
AMFORA is the Dutch acronym for Alternative Multifunctional Underground Space Amsterdam.  At a meeting of the Enlightened Underground international conference on Jan 29, the engineering firm, Strukton, revealed a plan for building a new Amsterdam, under the canals.   Together with the architectural firm, Zwarts & Jansma, they released a concept book (not available any more – june 2018) illustrating this underground future.  The plan would reduce traffic in the city, providing underground parking, park-and-ride facilities, shops, entertainment, and sports facilities.

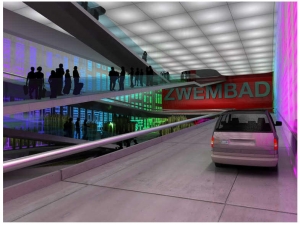
There would be a positive impact on the environment, health, and quality of life with the crowded canal-side roads transformed into broad foot (and bike) paths. Somehow, a by-product of the process would be cleaner canals, clean enough to swim in.   This is truly an ”adaptation” scenario for global warming, as the land of Hans Brinker, turns into the costa del sol of the future.  The project images are wonderful, the idea is fantasmagoric.

Update 17/6/2018: AMFORA in het Stadslab van het Amsterdam Museum

DESERTEC, REC, eSolar, etc.

energy_super_gridAn article in Nature Magazine this month discusses realistic options for harvesting energy from the desert in Africa.   On the same day as the Nature article, Google announced RE<C, an initiative to look for renewable energy (“Google Green”?).  They are working with companies to explore new technology… one such company is eSolar Inc.

Update:  in 2012, Siemens pulled out of DESERTEC project.  See Article.
Update: 2017, the Dream didn’t die. See Article.
Update: 2017, eSolar goes AWOL.  See Article.

At the same time, yesterday the Club of Rome sponsored a presentation by the president of Jordan in Brussels.  The White Paper is here.  At least one Dutch company is active in this area, Free Energy International.  In coming days we will explore this area further and summarize investigations.
Update: 15/6/2018 – None of the old links can be found.

Heatloss Map

haringey_heatloss_mapAll Points Blog recently commented on an interactive map of Harringay (a London borough) showing on a house-by-house basis the amount of heat at the time of a “flyover” in the year 2000.  This public website has been somewhat controversial, but may point the way to a future application which could help identify soruces of heatloss.  A new flyover took place last March so the map will be updated.  An article in the Times (May 4, 2007).  A company called  Hotmapping carried out the survey and is offering their services to other boroughs.

According to a Times article:  “Almost 60 per cent of a household’s heat is lost through uninsulated walls and lofts, according to the Energy Saving Trust (EST), costing the average home up to £380 each year.  Insulation is estimated to reduce each home’s carbon emissions by about two tonnes annually. More than half of the UK’s carbon dioxide emissions come from the domestic sector, taking into account both homes and transport. “

Adaptation

elevateThe CCsP conference September 12 and 13 in Den Haag included many fascinating presentations by climate experts from the Netherlands, other European countries, Brazil and the US.    Many ongoing projects are looking at risks, costs, and even opportunities, focusing on two concurrent approaches:  mitigation and adaptation.  Dr. Jeroen Aerts from the Vrij Universeiteit discussed Climate adaptation: cross-sectoral approaches in relation to land use and spatial planning (ppt, 17.8Mb – link no longer available, 2018) .

Update June 2018 – Article co-authored by Aerts titled Integrating Human Behavior Dynamics into Flood Disaster Risk Asessment (available for a price!)
This news article describes the contents. https://www.cmcc.it/article/human-behavior-is-the-key-to-reducing-flood-risk