Heatloss Map
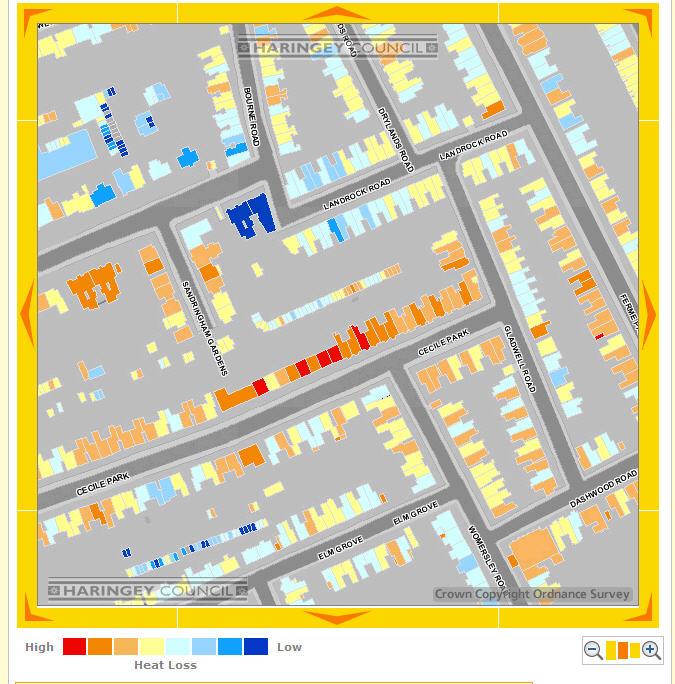 All Points Blog recently commented on an interactive map of Harringay (a London borough) showing on a house-by-house basis the amount of heat at the time of a “flyover” in the year 2000. This public website has been somewhat controversial, but may point the way to a future application which could help identify soruces of heatloss. A new flyover took place last March so the map will be updated. An article in the Times (May 4, 2007). A company called Hotmapping carried out the survey and is offering their services to other boroughs.
According to a Times article: “Almost 60 per cent of a household’s heat is lost through uninsulated walls and lofts, according to the Energy Saving Trust (EST), costing the average home up to £380 each year. Insulation is estimated to reduce each home’s carbon emissions by about two tonnes annually. More than half of the UK’s carbon dioxide emissions come from the domestic sector, taking into account both homes and transport. “
Leave a Reply
Want to join the discussion?Feel free to contribute!